JULY 2020
The National Flood Insurance Program and New Jersey
By Jake Bradt, Carolyn Kousky, and Zoe Linder-Baptie
Wharton Risk Management and Decision Processes Center, Wharton School, University of Pennsylvania
FLOOD RISK IN NEW JERSEY
New Jersey residents and visitors enjoy the amenities that come with its more than 1,800 miles of coastline, as well as interior rivers and other waterways. While supporting recreation, tourism, and many sectors of the economy, these waterways and coasts also introduce flood risk. New Jersey can experience coastal tidal flooding, storm water flooding, riverine flooding, and storm surge. Coastal flooding can be particularly damaging. The coastal zone covers 3,218 square miles and is home to 239 diverse communities. New Jersey is also incredibly dense in its urban areas, with 53 percent of the state’s total population residing in the coastal zone along the shore and rivers, putting their homes and businesses at risk of flooding.1,2
AN OVERVIEW OF THE NATIONAL FLOOD INSURANCE PROGRAM
Flood insurance can protect residents financially from the risk of property damage from floods. While flood damage is typically not covered by standard homeowners policies, flood coverage is available through the federal National Flood Insurance Program (NFIP).3 The NFIP, founded in 1968, is housed within the Federal Emergency Management Agency (FEMA) and is a voluntary partnership between the federal government and local communities. As of August 2019, 553 of New Jersey’s 565 municipalities participate in the NFIP.4
When communities join the NFIP, they must implement certain floodplain management regulations for new construction within the FEMA-mapped 100-year floodplain, the area with a 1% annual chance of flooding, also referred to as the Special Flood Hazard Area (SFHA).5 This area is shown on FEMA Flood Insurance Rate Maps (FIRMs). These maps divide the SFHA and the area beyond it into different flood zones. The A zones are the SFHA subject to flooding from rivers or streams or shallow flooding areas. V zones are narrow strips along the coast that are in the SFHA and also subject to storm waves.
Once a community joins the NFIP, all properties can be insured through the program, including residences, commercial structures, and municipal buildings. A residential property owner can purchase up to $250,000 of coverage for their building and up to $100,000 of coverage for its contents. Renters can purchase a contents-only policy. Non-residential property owners, such as commercial and municipal properties, can purchase up to $500,000 of coverage each for the structure and its contents. When a flood occurs, the policyholder will be reimbursed for damage up to the coverage limit they choose.
Early in the history of the NFIP, Congress responded to low take-up rates for flood insurance with the mandatory purchase requirement: federally regulated lenders or issuers of federally-backed mortgages must require flood insurance on all loans secured by property in the SFHA. This helped increase the number of flood insurance policies purchased, but flood risk persists outside the SFHA. Despite this, few people insure when not mandated to do so. This is due to a combination of poor understanding about the risk, lack of understanding about the role of flood insurance in recovery, as well as beliefs that flood insurance is too expensive, and/or budget constraints. Research indicates that premiums are often cost prohibitive for low income households. There are ongoing efforts to make changes to the NFIP program as well as to find other avenues through which communities can insure for flood risk.6
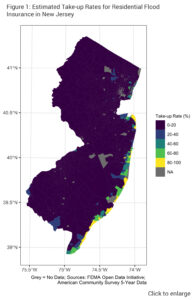
NFIP PURCHASES IN NEW JERSEY In New Jersey there were 250,561 policies-in-force (including both commercial and residential policies) across the state in 2018, the most recent full year for which data are available.7 This makes New Jersey fourth in the nation in terms of NFIP policies behind Florida, Texas, and Louisiana. NFIP policies tend to be concentrated in coastal areas. Figure 1 shows take-up rates for all NFIP policies in New Jersey by census tract (that is, the number of NFIP policies in each tract divided by the number of housing units in each tract). Note that census tracts are small areas of about 4,000 inhabitants and do not correspond to political boundaries. As seen in the figure, take-up rates are much lower away from the coast but can exceed 75% for tracts that border the ocean.
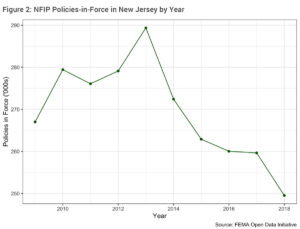
The number of policies-in-force in New Jersey has been declining in recent years as shown in Figure 2. Policies were increasing and then spiked after Hurricane Sandy; this could be due to greater purchases after the storm brought attention to flood risk, but also is due to the requirement that recipients of federal disaster aid purchase flood insurance.8 Due to a lack of comprehensive and detailed data on flood insurance provided by the private sector, it is impossible to determine how much of this recent decline has been offset by an increase in private-sector flood insurance policies.
 NFIP PREMIUMS
Currently, annual premiums for an NFIP policy vary by FEMA mapped flood zones, as well as by other characteristics of the building, including when it was constructed and its elevation. Figure 3 shows the average premiums for policies in New Jersey. The highest prices are for properties in the V zone – the area of the SFHA also subject to waves and storm surge. The average annual New Jersey premium in the V zone was $4,738 in 2018. In the A zone, the average premium was $1,272. Outside the SFHA, properties with a favorable loss history may qualify for a Preferred Risk Policy (PRP),9 which costs substantially less. The median for a PRP policy was $410. Note that premiums also vary based on how much coverage is purchased.
CLAIMS PAID
As of August 2019, New Jersey policyholders had cumulatively received roughly $5.268 billion (2018 USD) in total payments on 160,169 claims, only 7.57% of which were for commercial properties. The overwhelming majority of claims paid were in 2012 for Hurricane Sandy. This is seen clearly in Figure 4, which shows claims made to the state in billions of 2018 USD by year. The year Sandy hit – 2012 – shows close to $4 billion in losses paid on over 68,000 claims, only 3.94% of which were for commercial properties. (Larger firms may have comprehensive property insurance from a private carrier and not use the NFIP. Small businesses, though, are often uninsured and would use the NFIP for flood coverage similar to a household.)
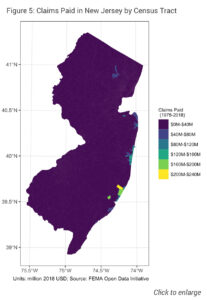
 As might be expected, given the storm, and the earlier figure showing where NFIP policies are concentrated, claims have largely been concentrated on the coast, as well. The most claims are in areas of higher take-up where Sandy had an impact – this is seen in Figure 5. In the week after Hurricane Sandy made landfall, the average claim was $151,244 (2018 USD) for commercial properties and $59,997 for residential properties. This highlights the importance of insurance in financial recovery from disasters. In contrast to the almost $60,000 that was paid on average for flood insurance claims, FEMA individual Assistance grants averaged only a bit more than $8,000 (which includes some funds for uninsured costs, such as temporary housing). This is because post-disaster FEMA grants are only to make homes safe and habitable, not bring them back to pre-disaster conditions.
THE COMMUNITY RATING SYSTEM
Since 1990, the NFIP has encouraged communities to join the Community Rating System (CRS), a voluntary program designed to encourage more investment in flood risk reduction. Class levels range from 1 to 10 with Class 1 providing the highest discount on premiums. A CRS community earns points for activities undertaken to better manage flood risk, including providing improved information on flood risk and flood insurance to residents. As a community moves up through levels in the program, their residents are rewarded with discounts on flood insurance. Note that PRP policies do not receive CRS discounts, as they are already a more favorable price. As of August 2019, 96 of the 553 New Jersey communities participating in the NFIP are in the CRS program. Many of these communities have a Class 5 or higher, indicating they have adopted many flood risk management policies. This includes Ocean City, Brigantine, Sea Isle City, and Long Beach.10
THE NFIP AND NEW JERSEY
As discussed, flood insurance is a critical component of financial recovery from flood events. Many households lack sufficient savings to rebuild on their own and federal aid is limited and delayed. Unfortunately, however, those who often need insurance the most are least able to afford it. FEMA and scholars have proposed a means-tested assistance program to help lower-income families afford flood coverage, but Congress has yet to adopt and enact this change.11 As climate change increases flood risk, particularly along the coast, flood insurance will also have to be complemented by aggressive investments in risk reduction and risk communication to promote resiliency of New Jersey communities.
FOOTNOTES
1 “Climate Change Resilience Strategy.” New Jersey Department of Environmental Protection. 2020. https://www.nj.gov/dep/climatechange/resilience-strategy.html.
2 Kopp, R.E., C. Andrews, A. Broccoli, A. Garner, D. Kreeger, R. Leichenko, N. Lin, C. Little, J.A. Miller, J.K. Miller, K.G. Miller, R. Moss, P. Orton, A. Parris, D. Robinson, W. Sweet, J. Walker, C.P. Weaver, K. White, M. Campo, M. Kaplan, J. Herb, and L. Auermuller. New Jersey’s Rising Seas and Changing Coastal Storms: Report of the 2019 Science and Technical Advisory Panel. Rutgers, The State University of New Jersey. Prepared for the New Jersey Department of Environmental Protection. Trenton, New Jersey.
3 While there is a small, but growing, private market for residential flood insurance, nationally, as well as in New Jersey, the overwhelming number of residential flood policies are still with the NFIP—our focus in this brief.
4 “New Jersey – Top 50 National Flood Insurance Program (NFIP) Policy Count Communities and Community Rating System (CRS) Participation.” CRS Resources. 2020. https://crsresources.org/files/100/maps/states/new_jersey_crs_map_october_2019.pdf
5 “Floodplain Management Requirements.” FEMA. 2020. https://www.fema.gov/floodplain-management-requirements.
6 See more in Kousky, C., Shabman, L., Linder-Baptie, Z., St. Peter, E. (2020) Perspectives on Flood Insurance Demand Outside the 100-Year Floodplain. Philadelphia, PA: Wharton Risk Management and Decision Processes Center, University of Pennsylvania. and Shabman, L., Kousky, C., Lingle, B. (2019). The Mandatory Purchase Requirement: Origins and Effectiveness in Achieving NFIP Goals. Philadelphia, PA: Wharton Risk Management and Decision Processes Center, University of Pennsylvania.
7 In-force policies are counted as the number of insured units across all relevant contracts which are active in a given year. Data on the number of insured units for contracts covering multiple units (e.g., condominiums) are used to count the number of policies-in-force. So while a contract covering 10-units within a condominium only appears once in the data, the policies-in-force figure accounts for the fact that the single contract includes 10 insured units. Unless otherwise noted, all statistics and figures include both commercial and residential policies.
8 Kousky, C. (2017). “Disasters as Learning Experiences or Disasters as Policy Opportunities? Examining Flood Insurance Purchases after Hurricanes.” Risk Analysis 37(3): 517-530.
9 To qualify for a PRP rate, a property must be in a B, C, X, AR or A99 zone on the policy effective date and at each renewal (no grandfathering of PRP rates) in addition to having a favorable loss history. A property does not meet the condition for favorable loss history if any of the following conditions are met for the prior 10 years: (1) three or more NFIP claims for separate events, (2) two flood claims in excess of $1000 each for two separate events, (3) three separate Federal flood disaster relief payments (grants or loans), (4) two Federal flood disaster relief payments in excess of $1000, or (5) one flood insurance claim and one Federal flood disaster relief payment, both in excess of $1000.
10 “New Jersey – Top 50 National Flood Insurance Program (NFIP) Policy Count Communities and Community Rating System (CRS) Participation.” CRS Resources. 2020. https://crsresources.org/files/100/maps/states/new_jersey_crs_map_october_2019.pdf
11 See: FEMA (2018). An Affordability Framework for the National Flood Insurance Program. Washington, DC, Department of Homeland Security, Federal Emergency Management Agency.April 17; National Research Council (2015). Affordability of National Flood Insurance Premiums: Report 1. Washington, DC, National Academies Press
More Climate Briefs
Transportation and Climate

Ocean Acidification
How to Adapt to Climate Change
The National Flood Insurance Program and New Jersey
Climate-Smart Gardening
How to Reduce Your Greenhouse Gas Emissions
Farming, Food, and Climate Change in New Jersey

Climate Change, Health, and Equity in New Jersey


